Published February 25, 2026 · By Vlasov Edward · SeenLabs
Key Takeaways
According to Dallas Innovates and WFAA, Dallas leads all host cities with 9 matches and $2B+ projected economic impact
According to FIFA's official ticket demand data, Colombia vs Portugal in Miami is the single most-requested match globally
NY/NJ hosts the Final on July 19 — the highest revenue opportunity of the entire tournament
Spanish is the dominant non-English language in 8 of 11 host cities; Portuguese is critical for Miami and NY/NJ
Every World Cup 2026 host city has a different match count, a different fan demographic, a different language mix, and a different economic impact projection. For a business owner in Dallas, the playbook is different from a business owner in Seattle — even though both are preparing for the same tournament.
This guide breaks down each major US host city with the numbers that matter for businesses: how many matches, which fans, which languages, how much projected spending, and what digital signage strategy fits the local opportunity.
11US host cities — each with a unique fan demographic and match schedule
78of 104 total matches played on US soil
$17.2Bprojected US GDP boost from the tournament (FIFA/WTO study)
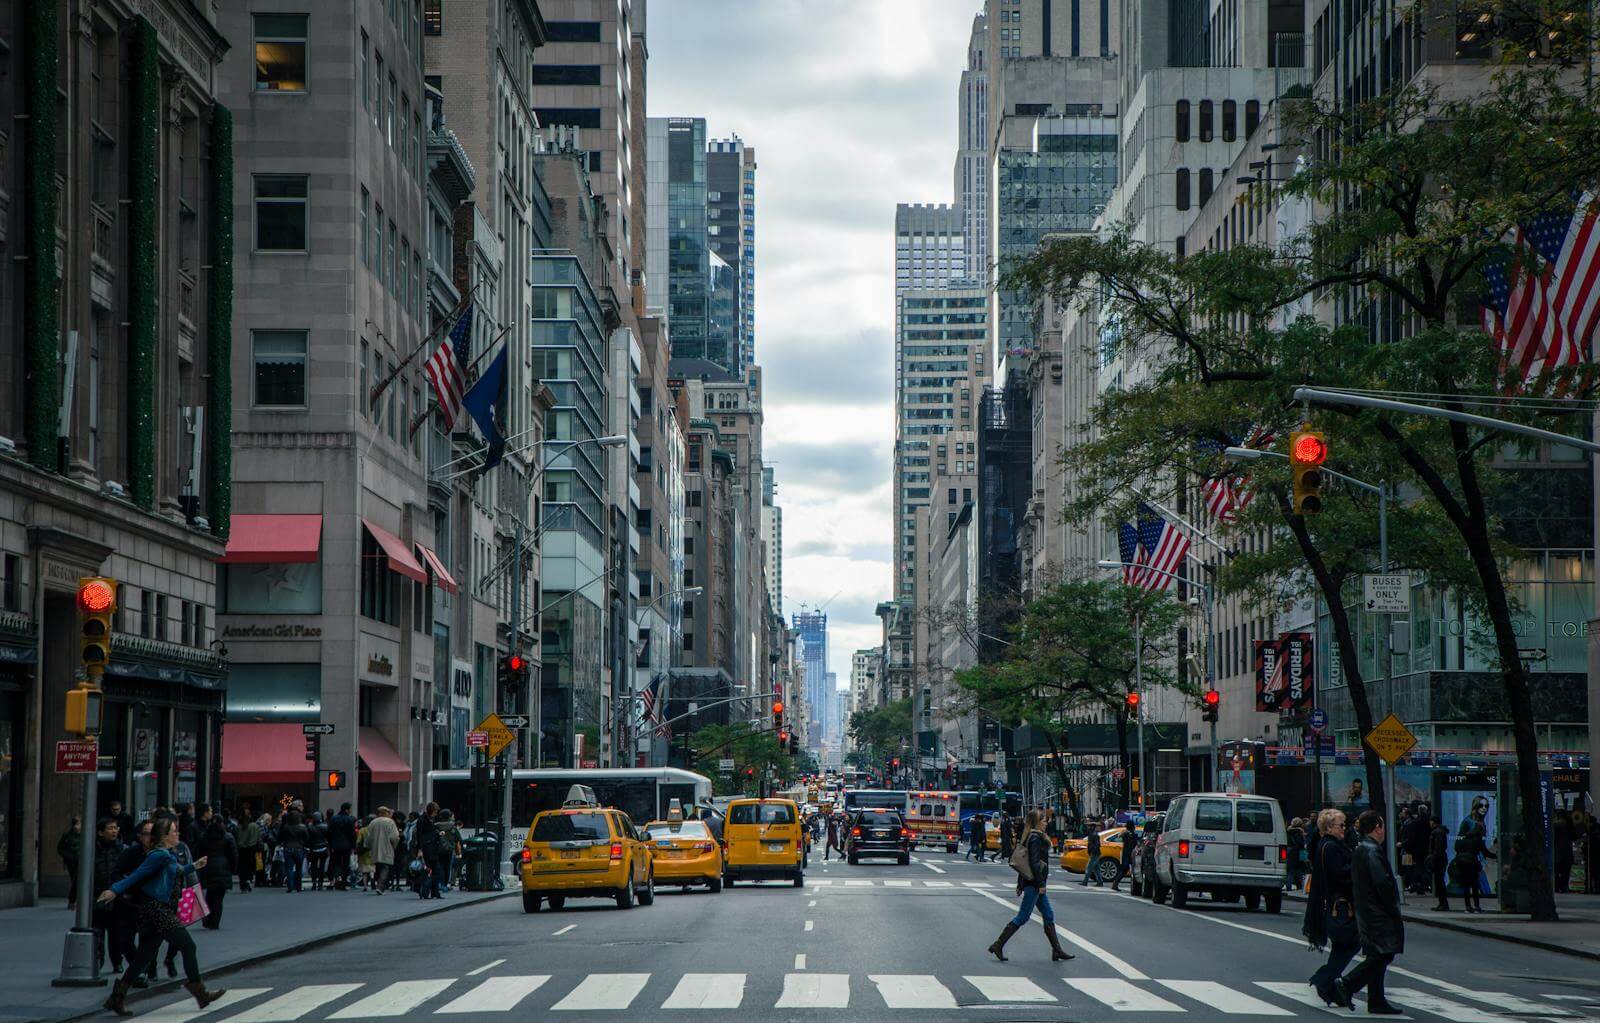
The Super Bowl frame: A Super Bowl generates $500M–$1.25B in one city for one week. The World Cup generates $17.2 billion across 11 US cities over 39 days. But unlike the Super Bowl — where every business in town faces the same crowd — each World Cup host city has a unique fan mix, language profile, and match schedule. That's why this guide exists: the signage strategy that works in Dallas doesn't work in Seattle.
How to use this guide: Find your city below. Each section gives you the match count, economic impact, expected fan origins, primary languages, and the digital signage products most relevant for local businesses. If your city isn't listed, the general principles still apply — the closer you are to a host city, the more fan spillover you'll capture.
Dallas / Arlington
AT&T Stadium — Most matches of any venue
9matches
$2B+projected impact
Spanishprimary language needed
According to Dallas Innovates and WFAA, Dallas hosts the most matches of any venue in the tournament (9 matches, $2B+ projected economic impact), including a semifinal. The $295 million AT&T Stadium renovation signals the city's commitment to the event. The fan mix will be heavily Spanish-speaking — Mexico, Colombia, Ecuador, and Argentina are the top ticket-requesting countries for Dallas matches.
Restaurant/bar priority:Multilingual table tents with Spanish-first menus. Match-night specials tied to the 9 individual match days.
Retail/storefront:Window displays with Spanish + English rotation. High-brightness needed — June/July in Dallas means direct sun most of the day.
Houston serves as an official training hub, meaning teams, media, and support staff will be based here for extended periods — not just match days. With 500,000 expected visitors and heavy Mexico/Colombia fan presence, Spanish-language business communication isn't optional — it's the default for a significant share of the audience.
Restaurant priority: Multilingual table tents with Spanish menus. Extended tournament presence (training hub) means consistent traffic, not just match-day spikes.
Hotel priority: Lobby displays with multilingual wayfinding and match schedules. Teams in residence = extended hotel stays beyond typical 2–3 night fan bookings.
Fan zone operators:Portable signage for outdoor viewing events. Houston's humidity and heat demand weather-rated equipment.
Miami
Hard Rock Stadium — Hosts the most-requested match on Earth
6matches
#1Colombia vs Portugal — most-requested globally
Spanish + Portuguesedual language need
Miami's unique position: according to FIFA's official ticket demand data, Colombia vs Portugal on June 27 is the single most-requested match worldwide. That means simultaneous Colombian (Spanish) and Portuguese fan populations — plus Brazil (Portuguese), Argentina (Spanish), and the existing Miami Latino community. This is the most linguistically complex host city.
Restaurant priority:Trilingual table tents — English, Spanish, Portuguese. Miami's existing bilingual infrastructure is an advantage, but Portuguese adds a third layer most restaurants aren't set up for.
Storefront priority: Window displays with multilingual content. Miami's tourism economy means storefronts already compete for attention — a dynamic display is the differentiator during peak tournament traffic.
Fleet priority: Car rooftop LEDs running Miami Beach → Hard Rock Stadium → Brickell/Downtown loops. High-density pedestrian areas around South Beach extend impression opportunities.
New York / New Jersey
MetLife Stadium — THE FINAL, July 19
8+matches inc. Final
$67Mdirect visitor spending
4+languages needed
Per FIFA's official schedule, New York/NJ hosts the Final on July 19 — the most watched single sporting event on Earth. The city's fan mix is the most diverse of any venue: Brazil (Portuguese), France (French), Germany (German), England and Scotland (English), Ecuador (Spanish). Hotels project $583/night average during the tournament. The knockout round booking pace shows 12.7% price increases.
Full signage suite: Table tents, window displays, and lobby signage all relevant. The most diverse language mix of any host city demands multilingual rotation across all business types.
Bar strategy:Match-night programming with language-aware content. NYC bars were surveyed after 2022 — 75% saw revenue increases. The Final will be the highest single-night revenue opportunity.
Hotel strategy:Lobby displays with Portuguese, French, and German rotation. NYC's existing infrastructure handles English — the international languages are the gap.
11 US host cities, 104 matches, 6.5 million attendees — each city with a distinct fan mix and digital signage opportunity.
Los Angeles / Inglewood
SoFi Stadium — USA opener June 12, 8 matches
8matches
179Kout-of-town visitors
Spanish + Koreankey languages
LA hosts the USA opener on June 12 (USA vs Paraguay) — the highest-profile match for domestic fans. The city also draws Mexico and Korea Republic supporters, creating a Spanish + Korean language mix that's unique among host cities. With $251M+ in local follow-on economic impact, the opportunity spans from Inglewood to Santa Monica.
Restaurant priority: Spanish + Korean multilingual table tents. LA's sprawling geography means fans will eat in neighborhoods across the metro, not just near SoFi.
Storefront priority: Window displays in entertainment corridors — Hollywood, DTLA, Santa Monica. Out-of-town visitors navigate by visual cue in unfamiliar areas.
Fleet priority: Car rooftop LEDs on LAX → Inglewood → Hollywood routes. 179K out-of-town visitors = sustained airport-to-venue transit for 8 match days.
Atlanta
Mercedes-Benz Stadium — Semifinal July 15
Semihosts semifinal
$52Mprojected spend
Spanishprimary language
Atlanta's semifinal on July 15 will draw the largest single-match audience of the city's tournament hosting. Colombia is the top non-host ticket-requesting country, making Spanish the dominant additional language. Atlanta's $120 million infrastructure investment underscores the city's commitment to the event.
Bar/restaurant priority: Table tents with Spanish menus and semifinal-themed match-night programming. The semifinal is the highest-stakes single match — fans spend more on celebration nights.
Storefront priority: Window displays in Midtown and downtown. Atlanta's concentrated entertainment district means foot traffic clusters predictably.
Seattle
Lumen Field — Strong international football culture
6matches
$929Mtotal economic impact
English + Frenchkey languages
Seattle projects the second-highest total economic impact ($929M) of any host city — a reflection of the city's existing international football culture around the Sounders. The fan mix includes strong English/Scottish and French contingencies. $652.6 million in direct spending flows through the local economy.
Restaurant/bar priority: Table tents with English and French rotation. Seattle's craft brewery and restaurant scene is a natural match for World Cup viewing — digital signage differentiates venues in a crowded market.
Fan zone priority:Portable signage for outdoor events. Seattle's summer weather is favorable for outdoor fan zones — rain is less likely in June/July.
Kansas City
Arrowhead Stadium — Argentina June 16
6matches
$653Mprojected impact
Spanishprimary language
Kansas City's match featuring Argentina on June 16 is a marquee draw. It's the smallest host city by metro population, but per-capita economic impact is massive at $653 million. The Missouri Restaurant Association has already launched "Lingo Eats" — a multilingual menu app for KC restaurants — signaling that the industry recognizes the language barrier as a real concern.
Restaurant priority:Multilingual table tents with Spanish menus. The Lingo Eats initiative validates the need — digital signage delivers the translated content to the table.
All businesses: Kansas City's smaller market size means every business is closer to stadium traffic. Even businesses not traditionally associated with sports events will see foot traffic increases during match weeks.
"No two host cities face the same World Cup. Dallas speaks Spanish across 9 matches. Miami needs Spanish and Portuguese for the most-requested match on Earth. Seattle needs French. The playbook isn't generic — it's local."
Dallas/Arlington hosts 9 matches at AT&T Stadium — more than any other venue. Los Angeles (SoFi Stadium) and New York/NJ (MetLife Stadium) each host 8+, with MetLife hosting the Final on July 19.
Which languages should my business prepare for?
It depends on your city. Dallas, Houston, Kansas City, and Atlanta need Spanish first. Miami needs Spanish and Portuguese. New York/NJ needs Portuguese, French, and German. Los Angeles needs Spanish and Korean. Seattle needs English and French. See each city section above for the specific fan demographics driving these recommendations.
Is my business too far from the stadium to benefit?
The displacement effect: the economic phenomenon where mega-event spending doesn't increase total revenue — it redistributes it from unprepared businesses to visibly prepared competitors. Documented by Clemson University researchers studying economic patterns at major sporting events.
No. World Cup fan movement spreads across entire metro areas, not just stadium neighborhoods. Fan zones, unofficial watch parties, and general tourism distribute visitors throughout the city. Clemson University research on the displacement effect confirms that mega-event spending doesn't distribute evenly — it shifts toward businesses that actively prepare and market themselves. A restaurant 5 miles from the stadium with multilingual signage and match-night programming will outperform an unprepared restaurant next door to the venue.
What digital signage product is right for my business type?
Restaurants and bars: digital table tents for multilingual menus and match-night specials. Storefronts: high-brightness window displays for foot traffic capture. Fleet operators: car rooftop LEDs for mobile advertising across fan transit routes. Event operators: portable digital signage for fan zones and pop-ups. Hotels: lobby window displays + restaurant table tents.
When should I order digital signage equipment for the World Cup?
By late April at the latest. Hardware procurement and installation takes 2–4 weeks. That leaves May for content setup and staff training before the June 11 tournament start. The earlier you order, the more time you have to build your content library and test the system before match days begin.
Sources & References
FIFA — Official Match Schedule, Venue Assignments, and Ticket Demand Data
Dallas Innovates / WFAA — Dallas 2026 World Cup Economic Impact Report
CoStar / Hotel Dive — Host Market RevPAR Projections
STR — Historical World Cup Hotel Performance (Qatar 2022, Russia 2018)
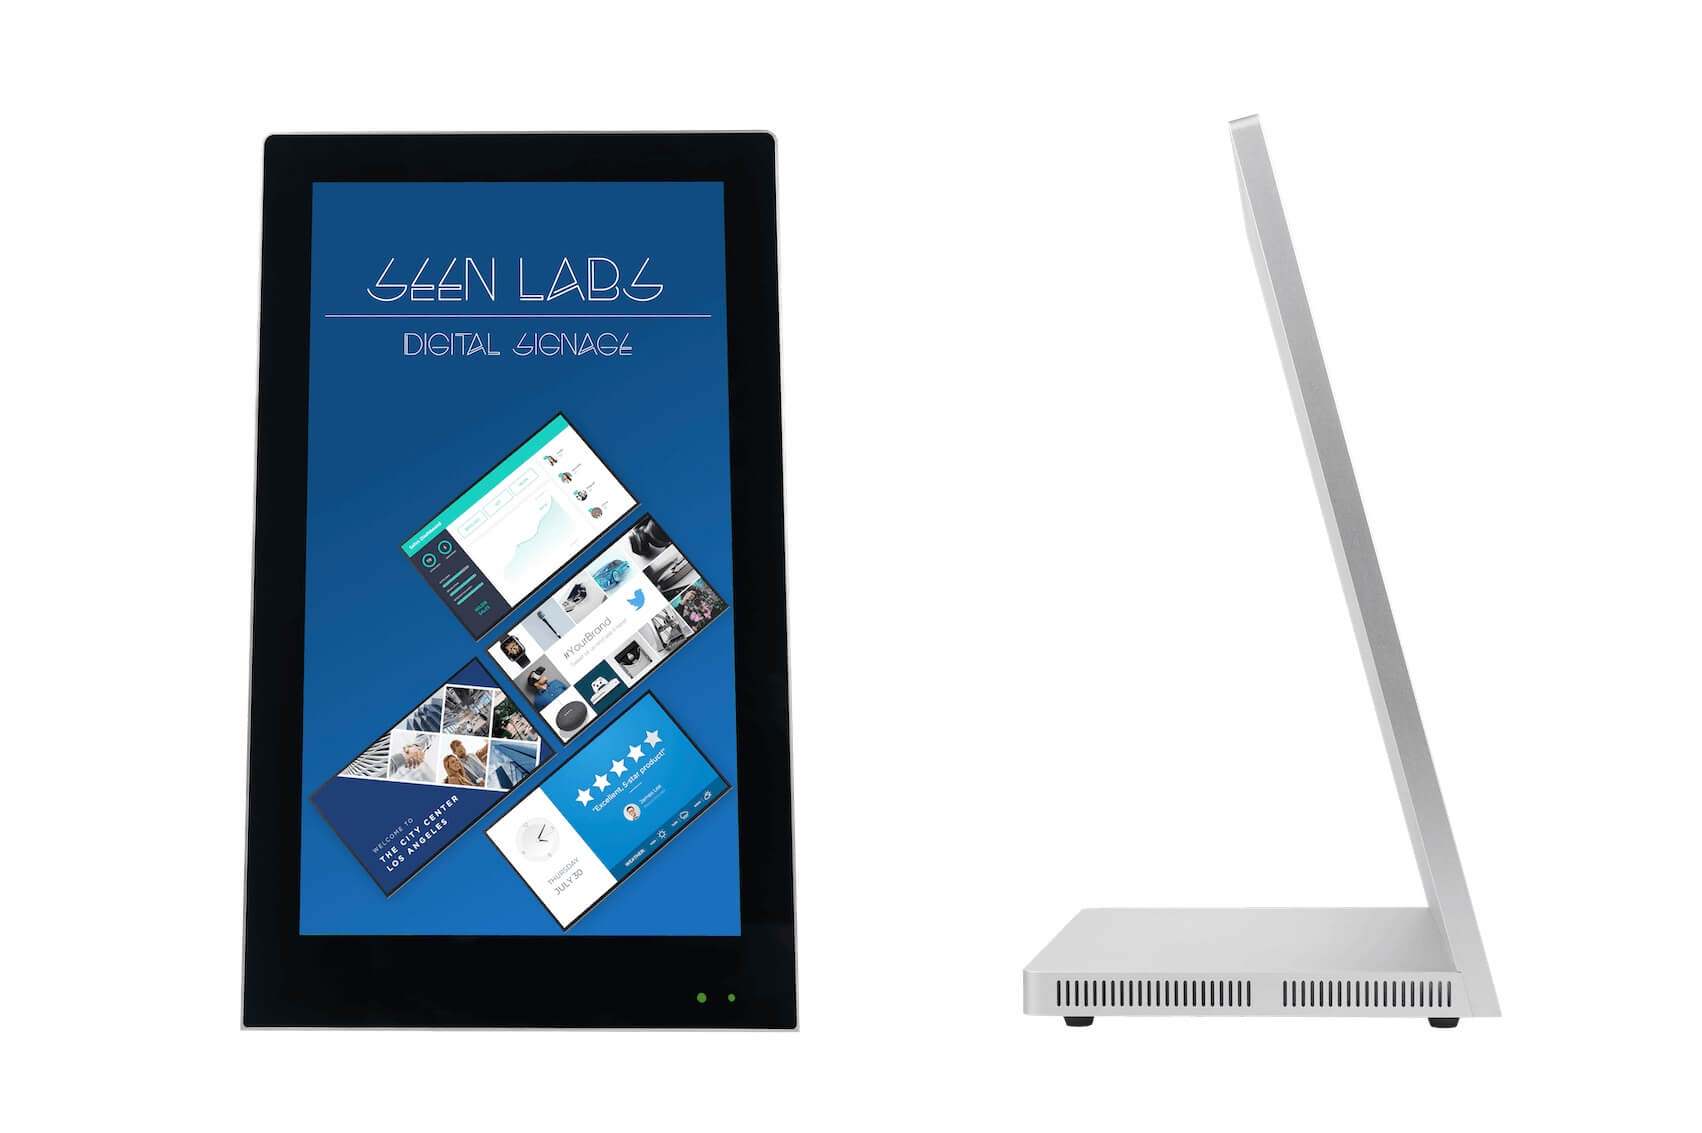
SeenLabs Digital Table Tent — The foundation of your World Cup signage strategy
Find the right signage for your city and business
SeenLabs serves all 11 US host cities with table tents, window displays, car rooftop LEDs, and portable signage. Tell us your city and business type — we'll recommend the right product and build a World Cup content plan.