Technology That Pays for Itself
Advertising signage is a business model, not just a communication tool. Your infrastructure needs to satisfy paid advertisers.
Proof-of-Play
Advertisers demand verification. Our logs record every second of playback with timestamps, ready for third-party auditing.
Scheduling Precision
Competitor separation (no Coke after Pepsi) and strict frequency capping ensure premium ad delivery standards.
Network Scale
Manage 10 or 10,000 screens. Group displays by venue type, geography, or CPM tier for efficient bulk scheduling.
Revenue Optimization
Maximize fill rates. Track inventory availability in real-time and integrate with programmatic platforms.
The Silent Salesman
It doesn't ask for a sick day. It doesn't forget the pitch. Digital Signage works 24/7, delivering the perfect message at the perfect time, ensuring your brand presence is constant and consistent.
Types of Advertising Networks
Venue-Based DOOH
Gyms, Bars, Waiting Rooms.
Model: Venue-owned or rev-share.
- Captive audience
- Long dwell time
- Contextual relevance
Transit & Outdoor
Shelters, Billboards, Taxis.
Model: High-impact reach.
- Massive scale
- Geo-targeting
- Short attention span
Retail Media Networks
In-store, End-caps, POP.
Model: Brand partnership.
- Closest to purchase
- First-party data usage
- High conversion
Niche Place-Based
Elevators, Gas Pumps.
Model: Pure volume.
- Unavoidable viewing
- High frequency
- Specific demographics
Critical Ad-Tech Capabilities
If you can't report it, you can't sell it. Our CMS is built for the ad industry.
1. Smart Scheduling
Dayparting: Coffee ads AM, Beer ads PM.
Flighting: Campaign starts May 1, ends May 31 auto-expire.
2. Monetization Tools
Rate Cards: Manage different pricing for different zones.
Inventory: See exactly what % of your network is sold vs. available.
3. Network Monitoring
Alerts: Instant notification if a screen providing revenue goes dark.
Remote Remediation: Reboot players from the cloud.
Hardware That Maximizes Views
Reliable infrastructure effectively lowers your Total Cost of Ownership (TCO).
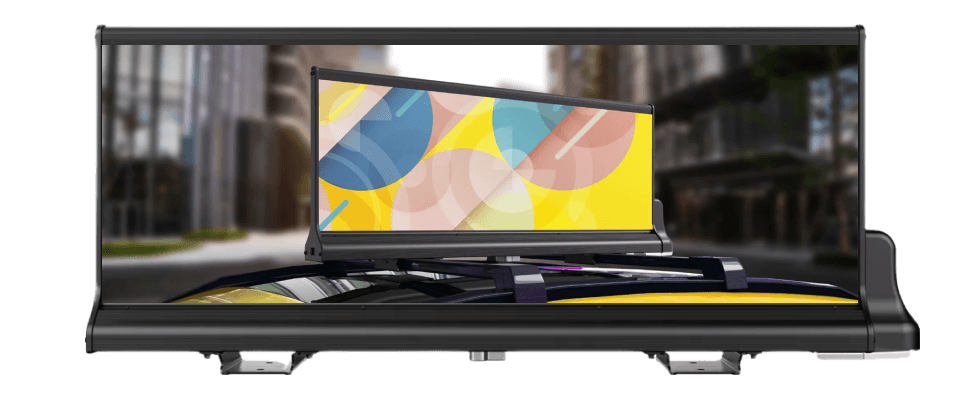
LED Rooftoppers
Best for Transit Networks. High-brightness mobile displays for taxis and rideshares. Includes 4G/5G connectivity and GPS for geo-targeted ads.
View products →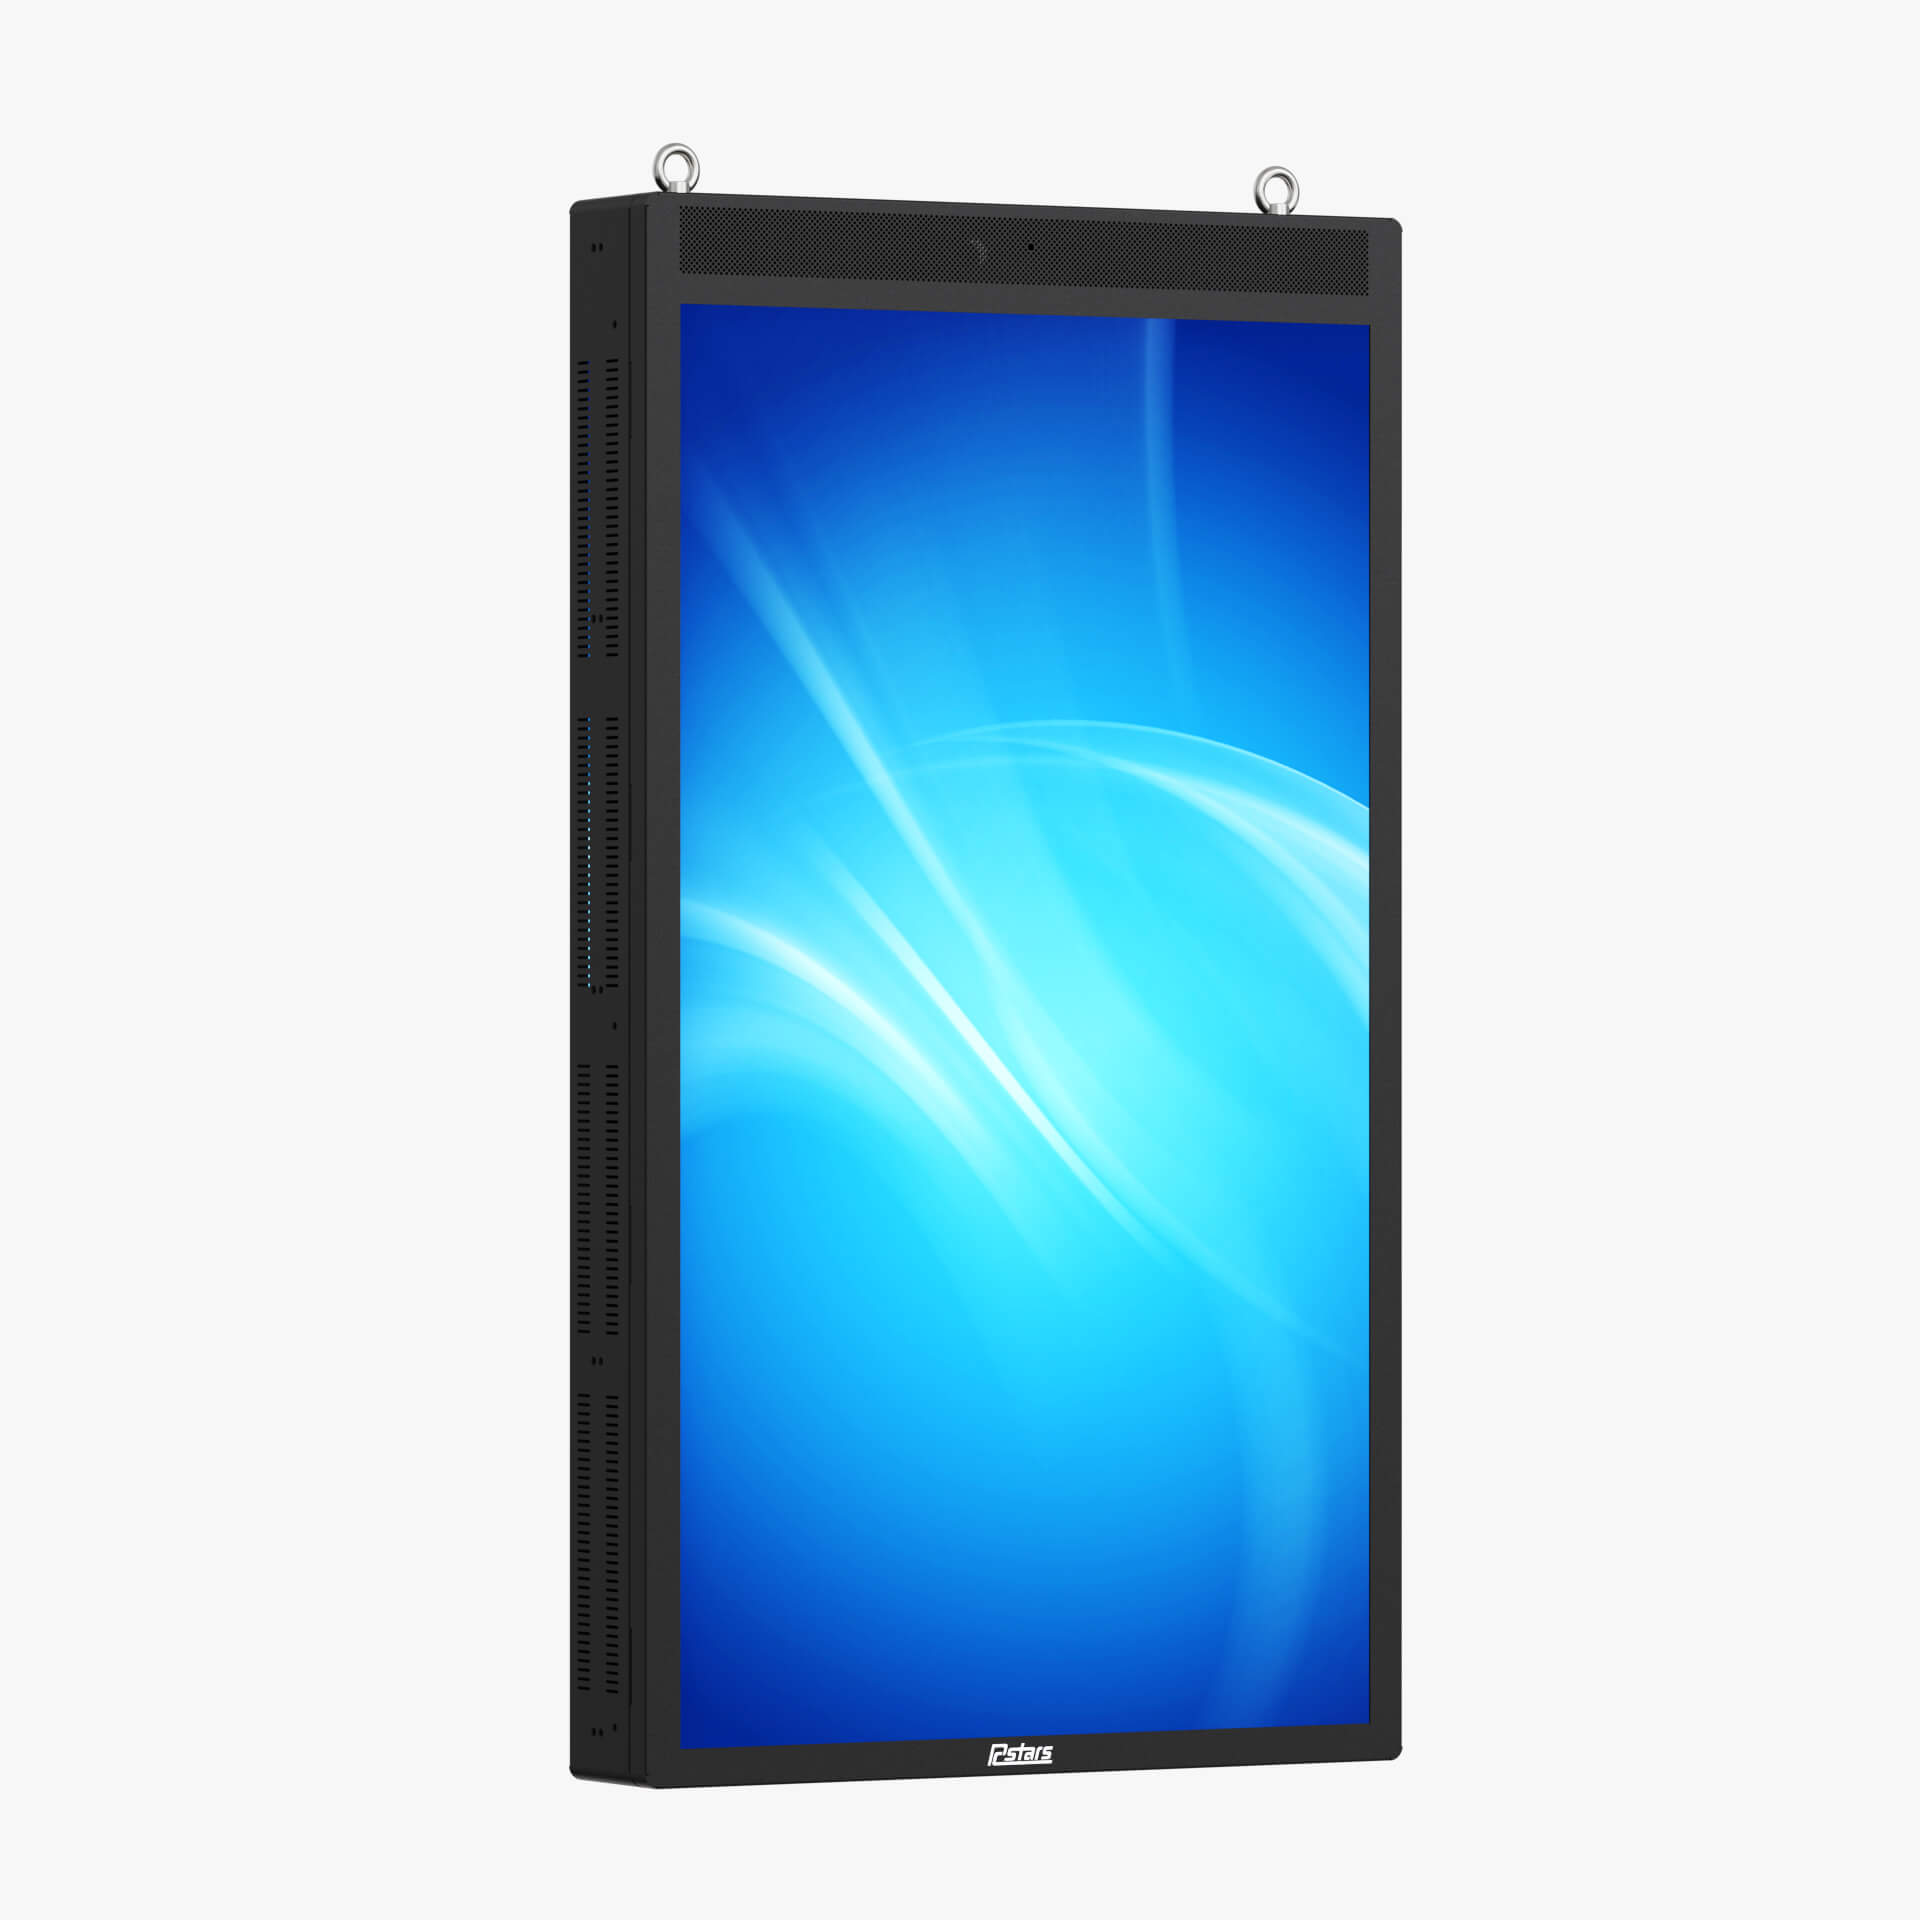
Ultra-Bright Window Displays
Best for Storefronts. Cut through glare with 3000+ nits. Perfect for capturing street traffic attention.
View products →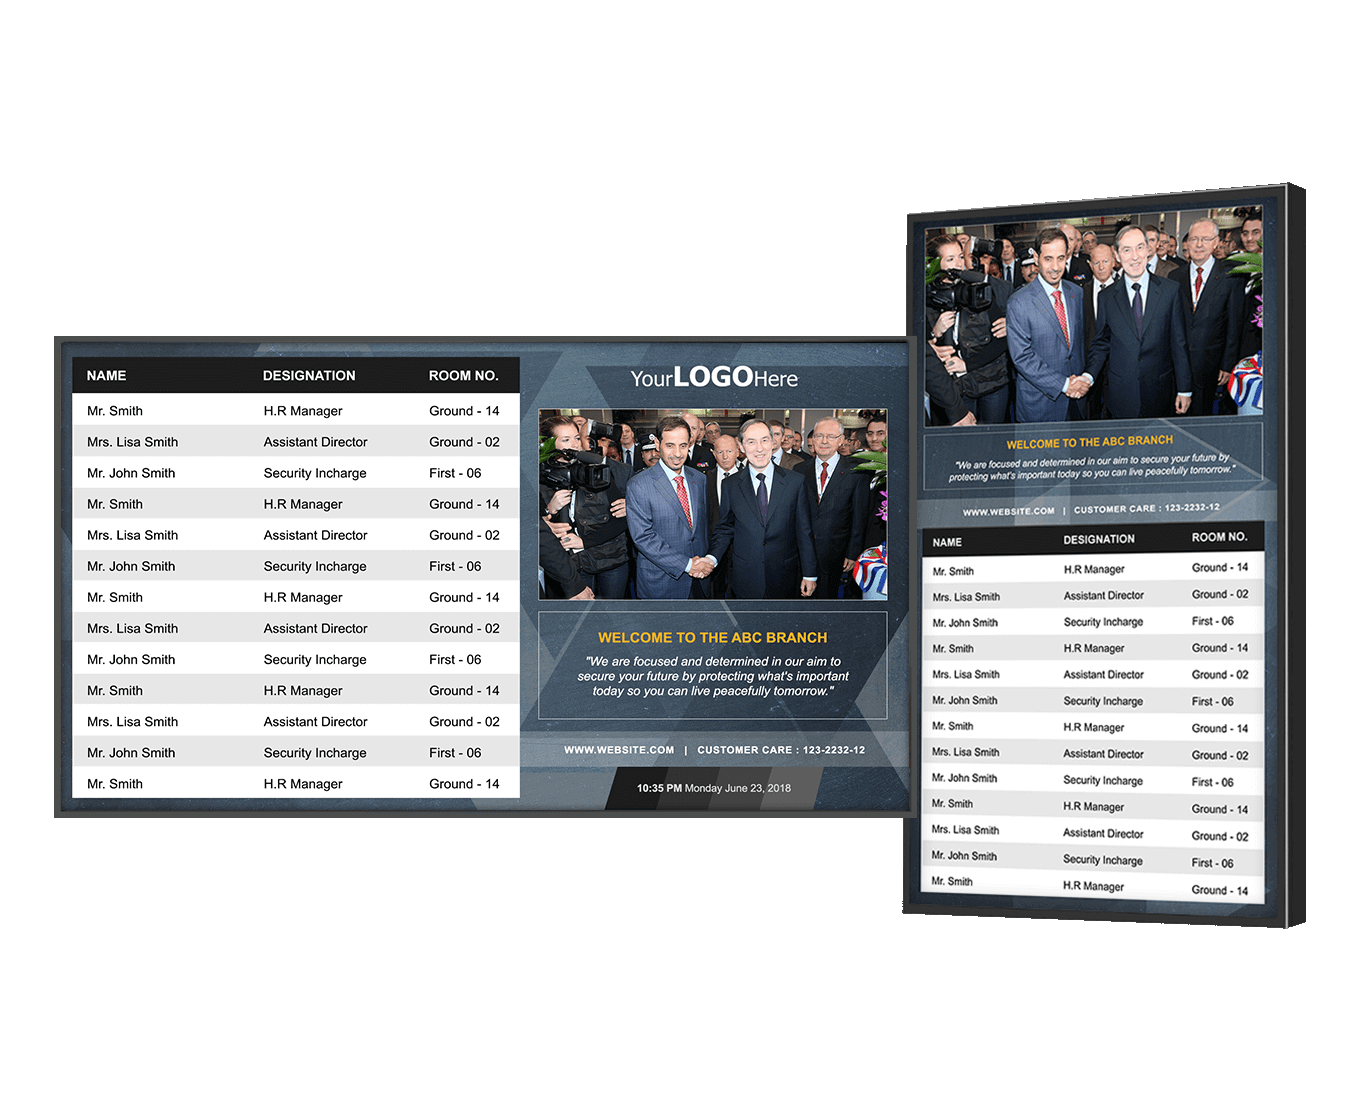
Commercial Indoor Display
Best for Venues. Rugged 24/7 operation panels for gyms, malls, and restaurants. Built to last 5+ years.
View products →The Perfect Ad Loop
Balance paid content with audience interest to keep eyes on the screen.
| Element | Duration | Purpose |
|---|---|---|
| Ad Spot A | 15 sec | National Brand (Paid) |
| Venue Content | 15 sec | News/Weather/Venue Info (Engagement) |
| Ad Spot B | 15 sec | Local Advertiser (Paid) |
| Network Filler | 15 sec | "Advertise Here" House Ad |
Programmatic Readiness
SeenLabs networks are VAST compliant and ready for integration with major programmatic exchanges (Broadsign, Hivestack, Vistar) to fill unsold inventory automatically.
Building Your Network
- Phase 1: Pilot (10-50 Screens). Prove the concept. Secure initial venue partners and gather engagement metrics.
- Phase 2: Market Expansion (100-500 Screens). Operationalize sales. Implement rigorous proof-of-play. Hire ad sales teams.
- Phase 3: Scale (500+ Screens). Network effects kick in. Programmatic integration becomes viable for filling inventory.
Venue Partnership Tips
- Value Prop: Offer venues free content slots (20% of loop) and a share of ad revenue.
- Infrastructure: Ensure venues have reliable power and internet before installing.
- Contracts: Sign 3-5 year exclusivity agreements to protect your hardware investment.
ROI for Ad Networks
Key Performance Indicators (KPIs)
Ready to Build Your Network?
Get a consultation on hardware, software, and go-to-market strategy for your DOOH network.